Introduction
The AI Powered Customer Dashboard is a Marketplace feature available within the Customer Portal, designed to give you a clear, real-time overview of your activity with your service provider.
It brings together key information on jobs, quotes, invoices and planned maintenance in a visual, easy-to-understand format. With interactive charts, filters and AI-generated summaries, you can quickly identify trends, monitor performance and stay up to date without needing to request manual updates.
The dashboard is tailored to the sites and data you have access to, helping you focus on what matters most, whether that’s tracking progress, reviewing outstanding work or identifying areas that may require attention.
This guide will walk you through how to access and use the dashboard, along with the key features available to help you get the most from it.
Note: This is a Marketplace App feature and must be enabled by your service provider.
Accessing the Dashboard
Where to find it
The AI-Powered Customer Dashboard can be accessed by any Customer Portal users who have been given permission to use it from their service provider.
To access:
-
Log into the Customer Portal using your credentials.
-
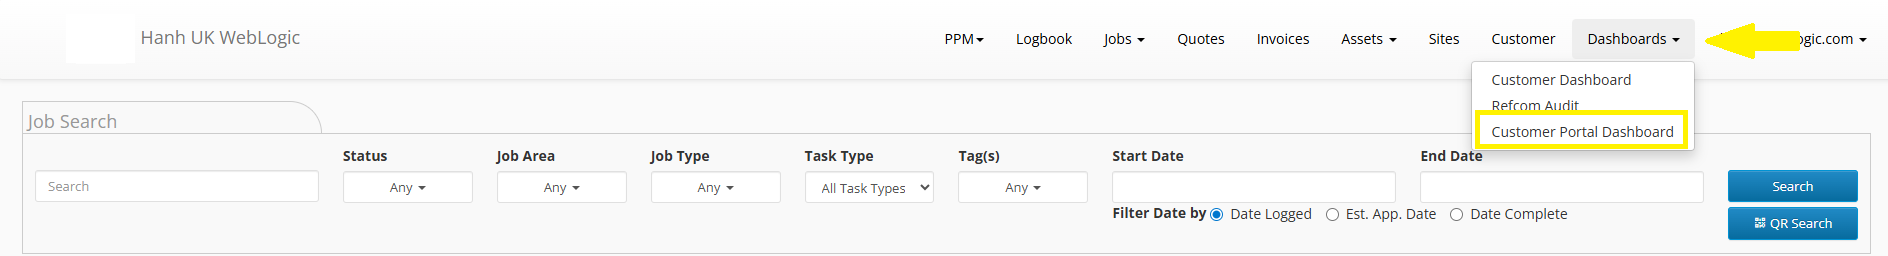
From the main navigation, select the “Dashboards” drop down and click the ‘Customer Portal Dashboard’ option.
Dashboard Overview
Layout and sections
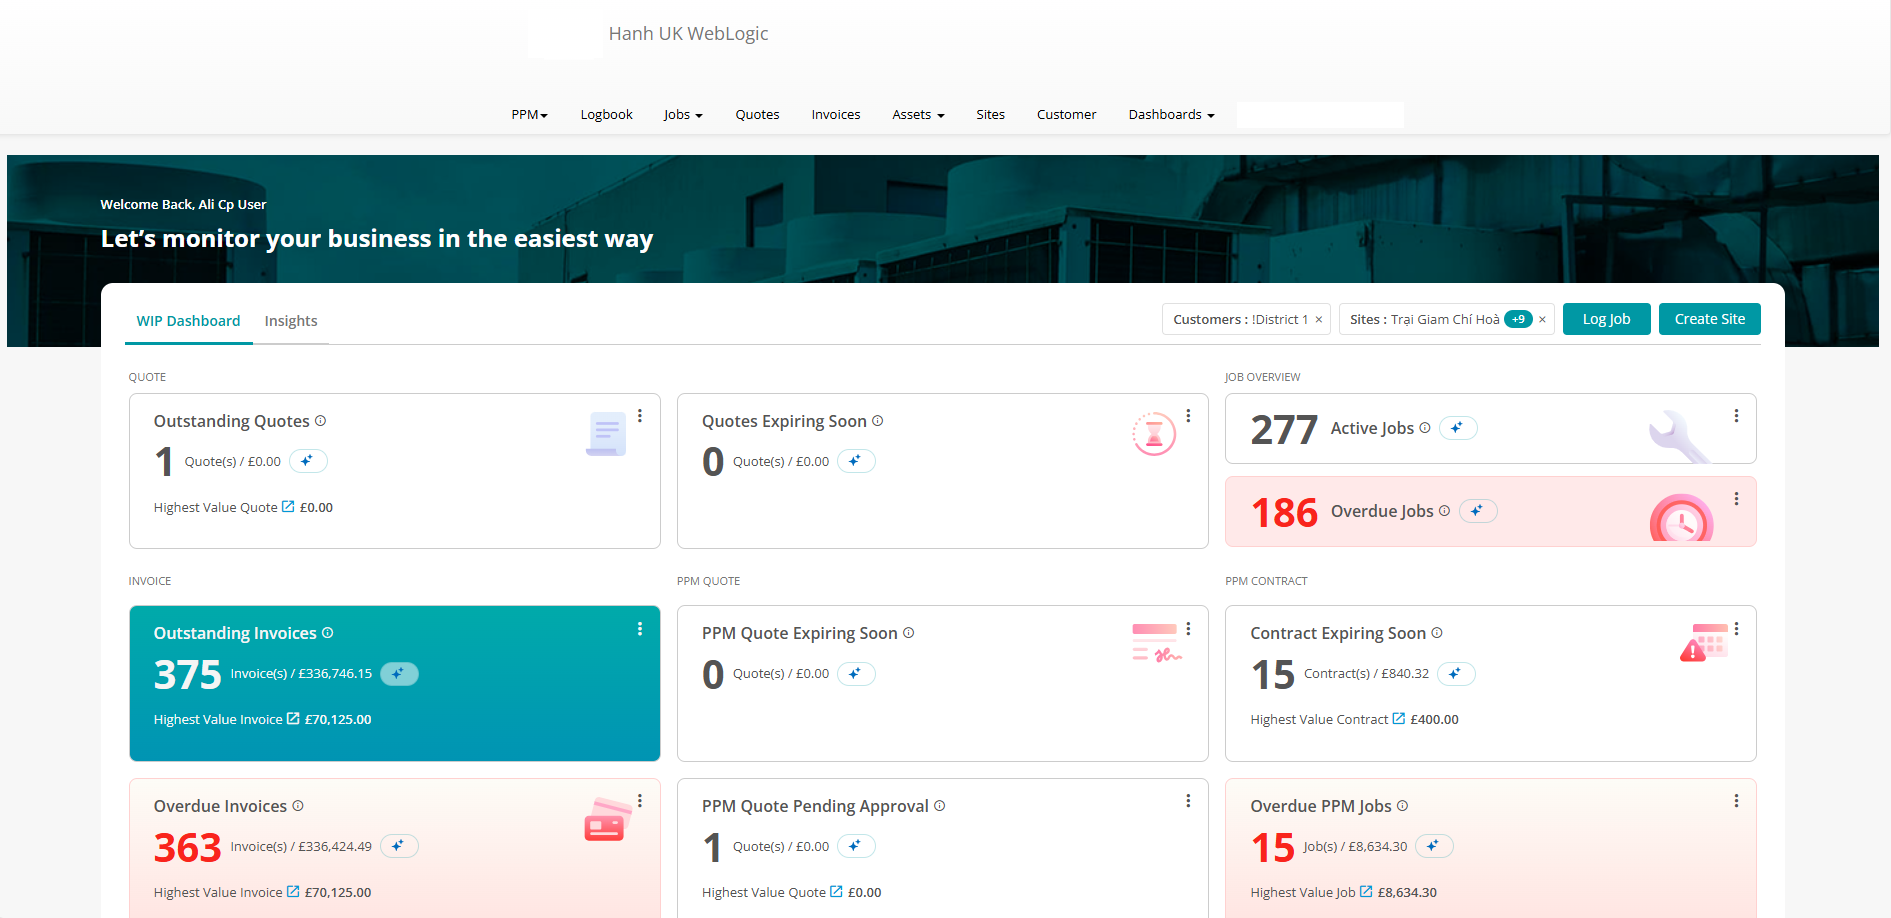
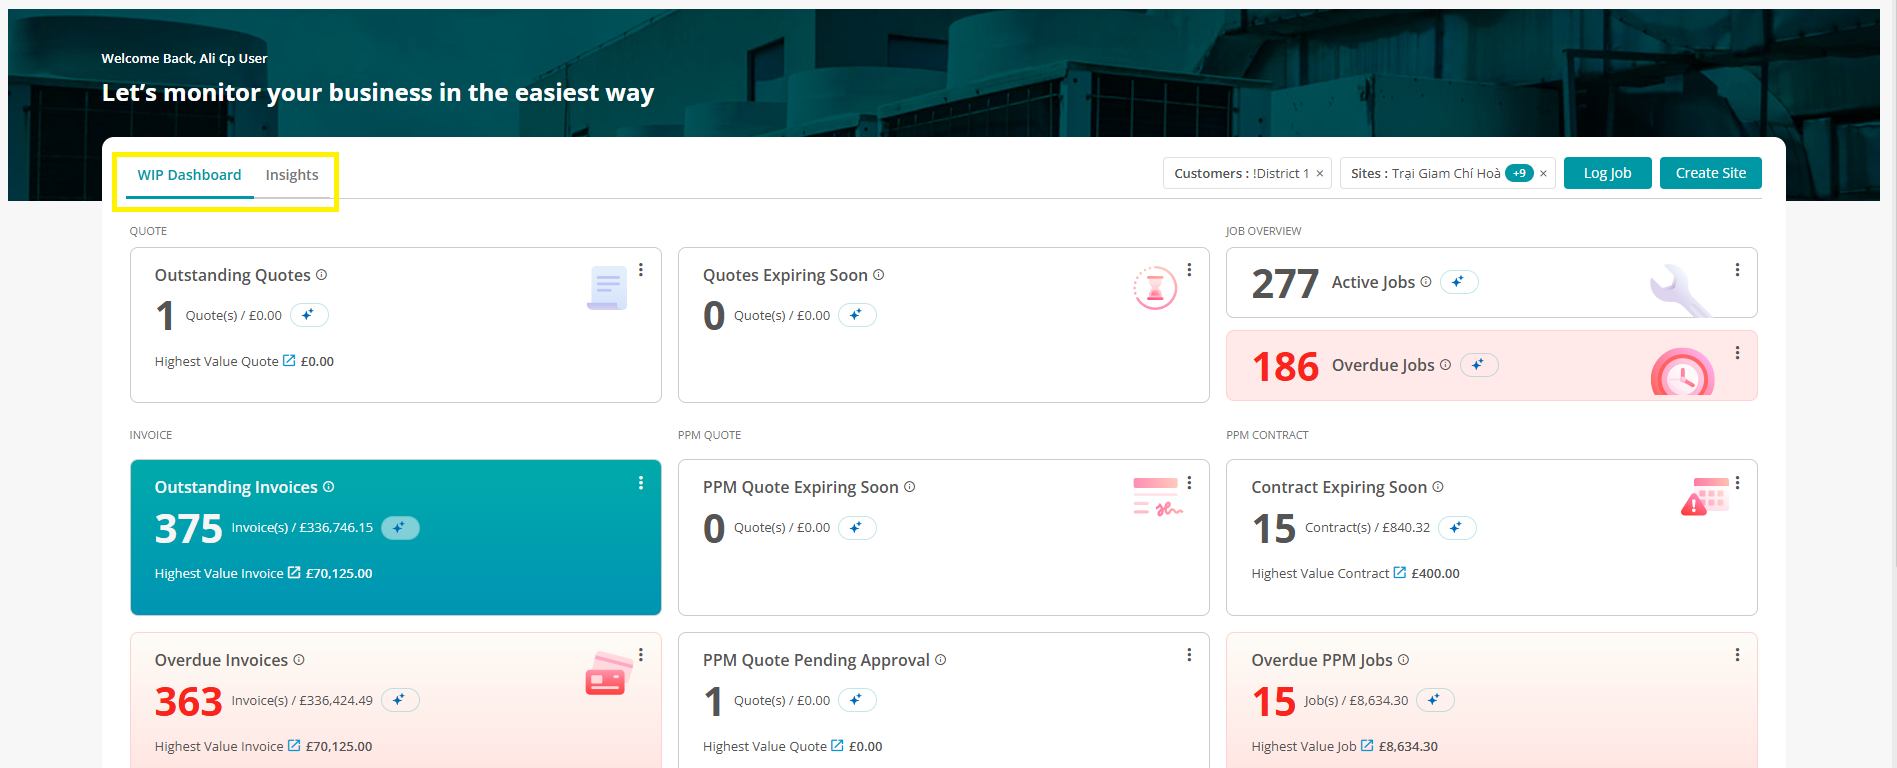
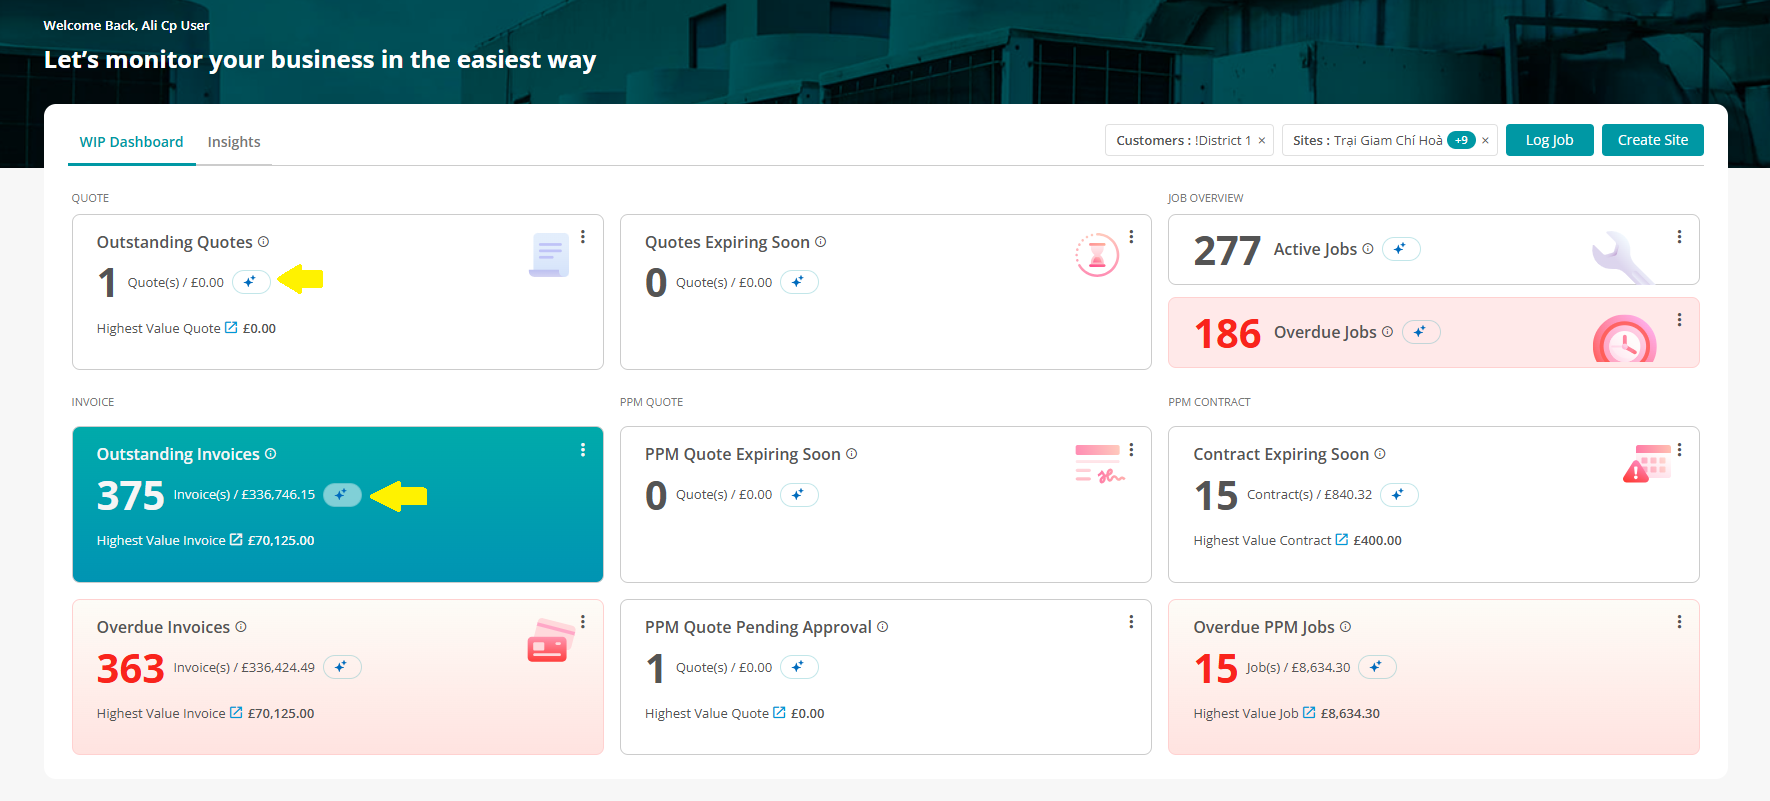
The dashboard is split into two main sections; a ‘WIP Dashboard’ page and an ‘Insights’ page.
Each can be viewed by selecting their respective tab.
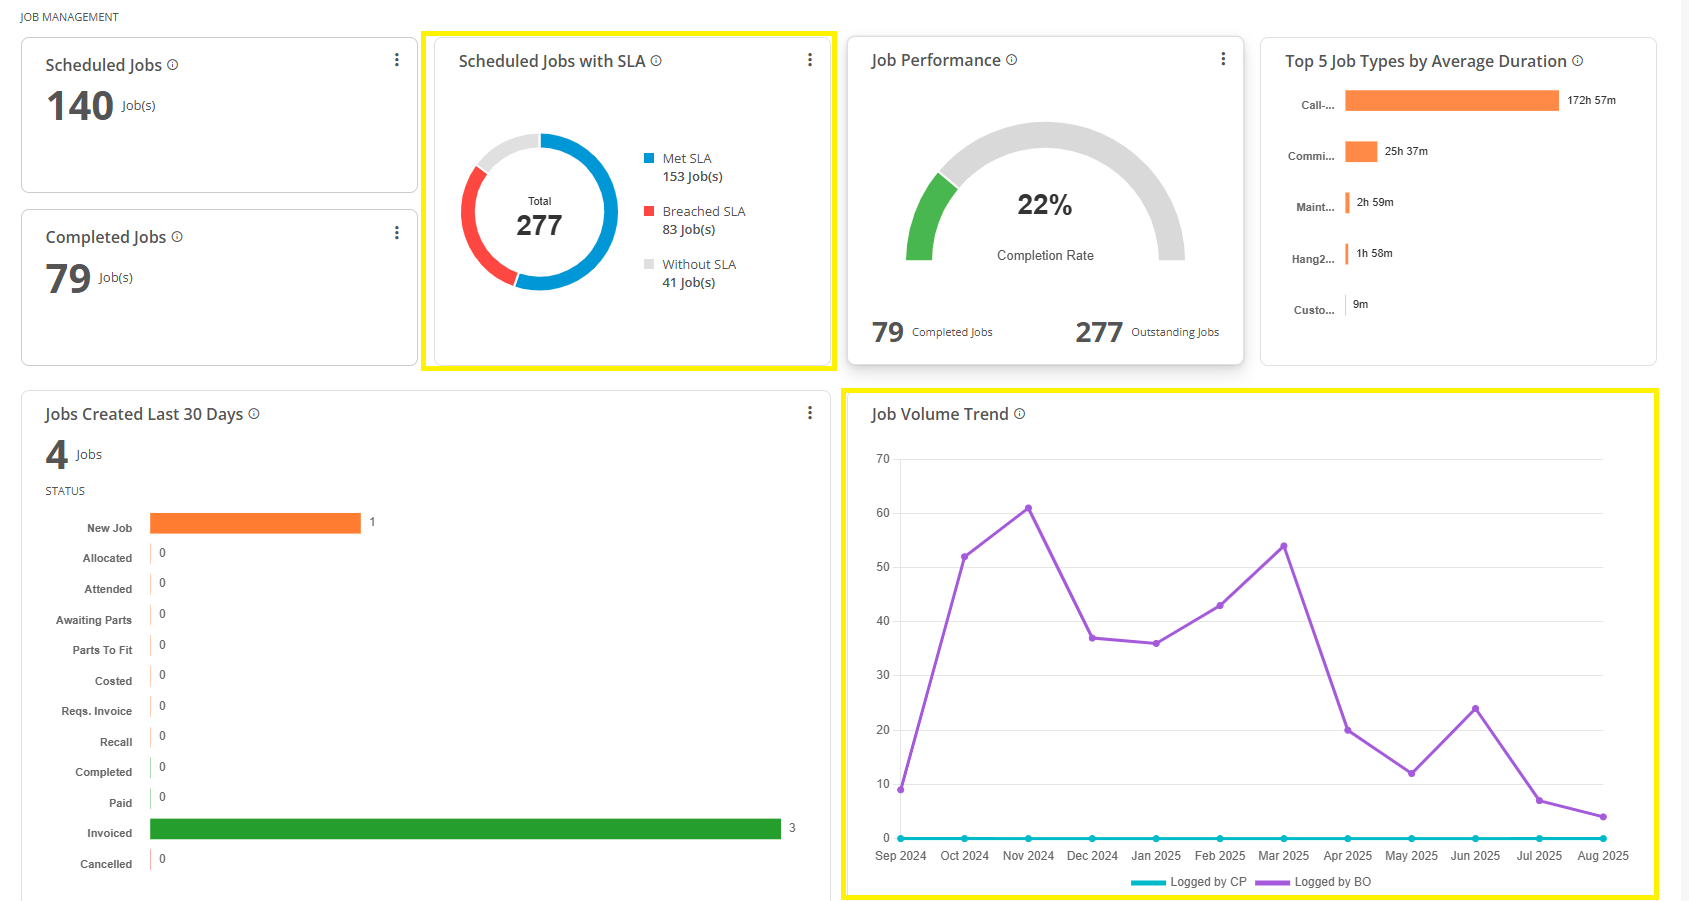
Each tab is then made up of a variety of visual aids that allow you to quickly and easily identify certain aspects of data and trends. These include:
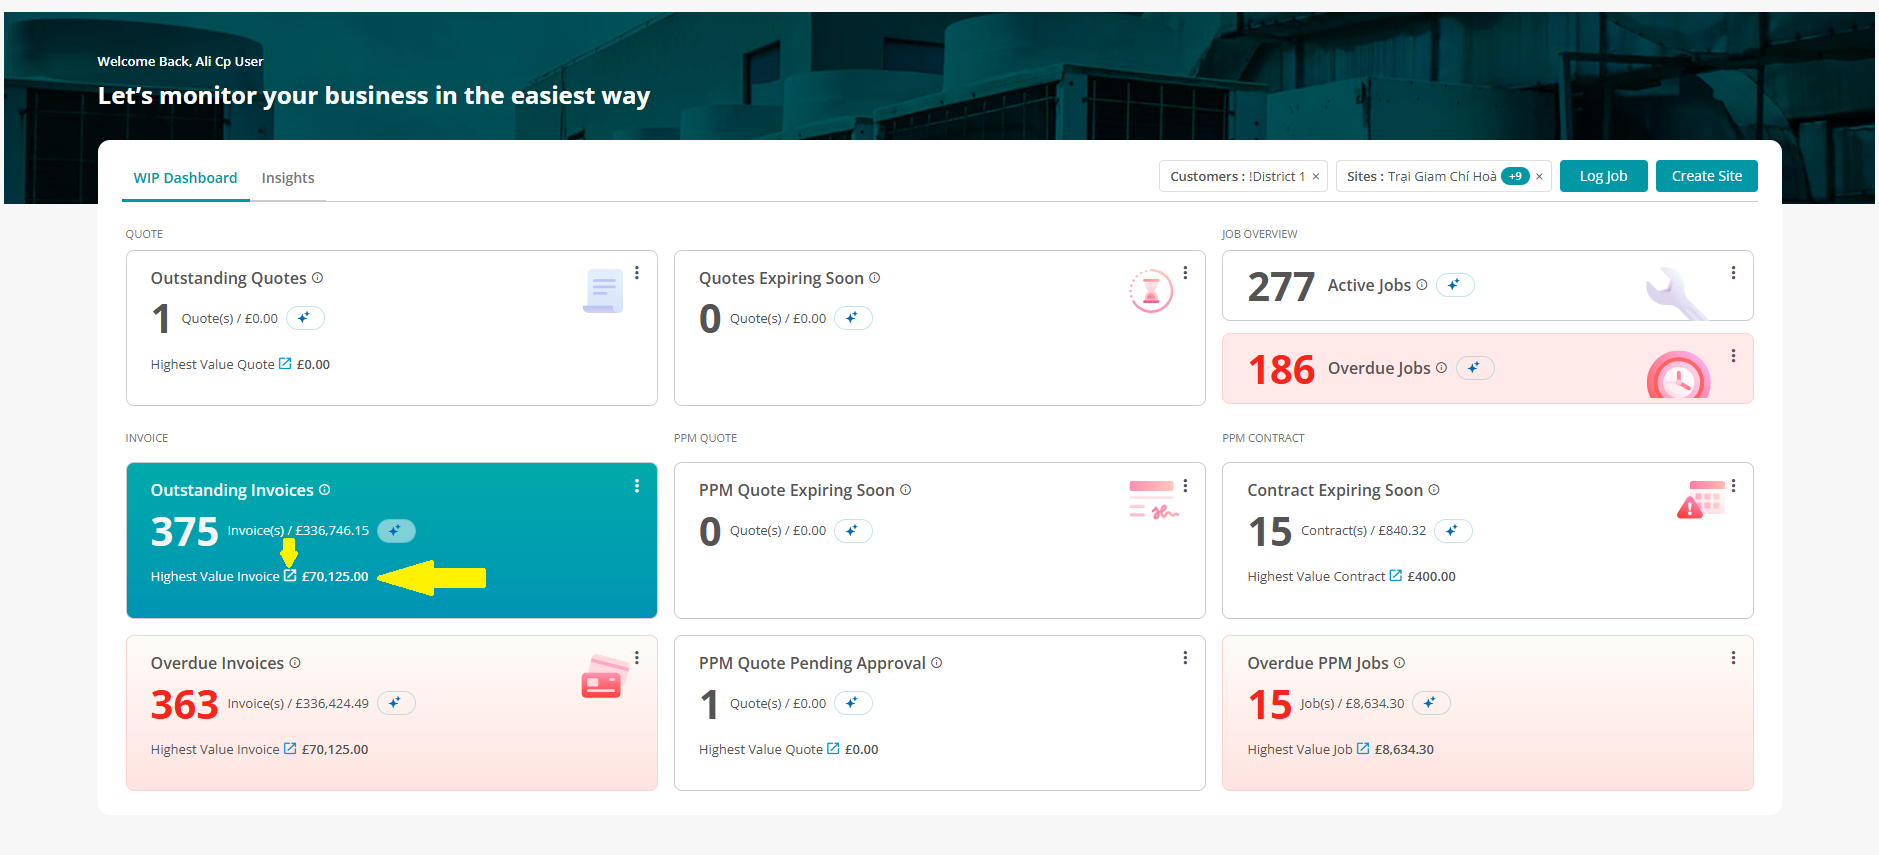
Visual Stat (statistic) Cards: Key headline figures for jobs, quotes, invoices and PPM contracts.
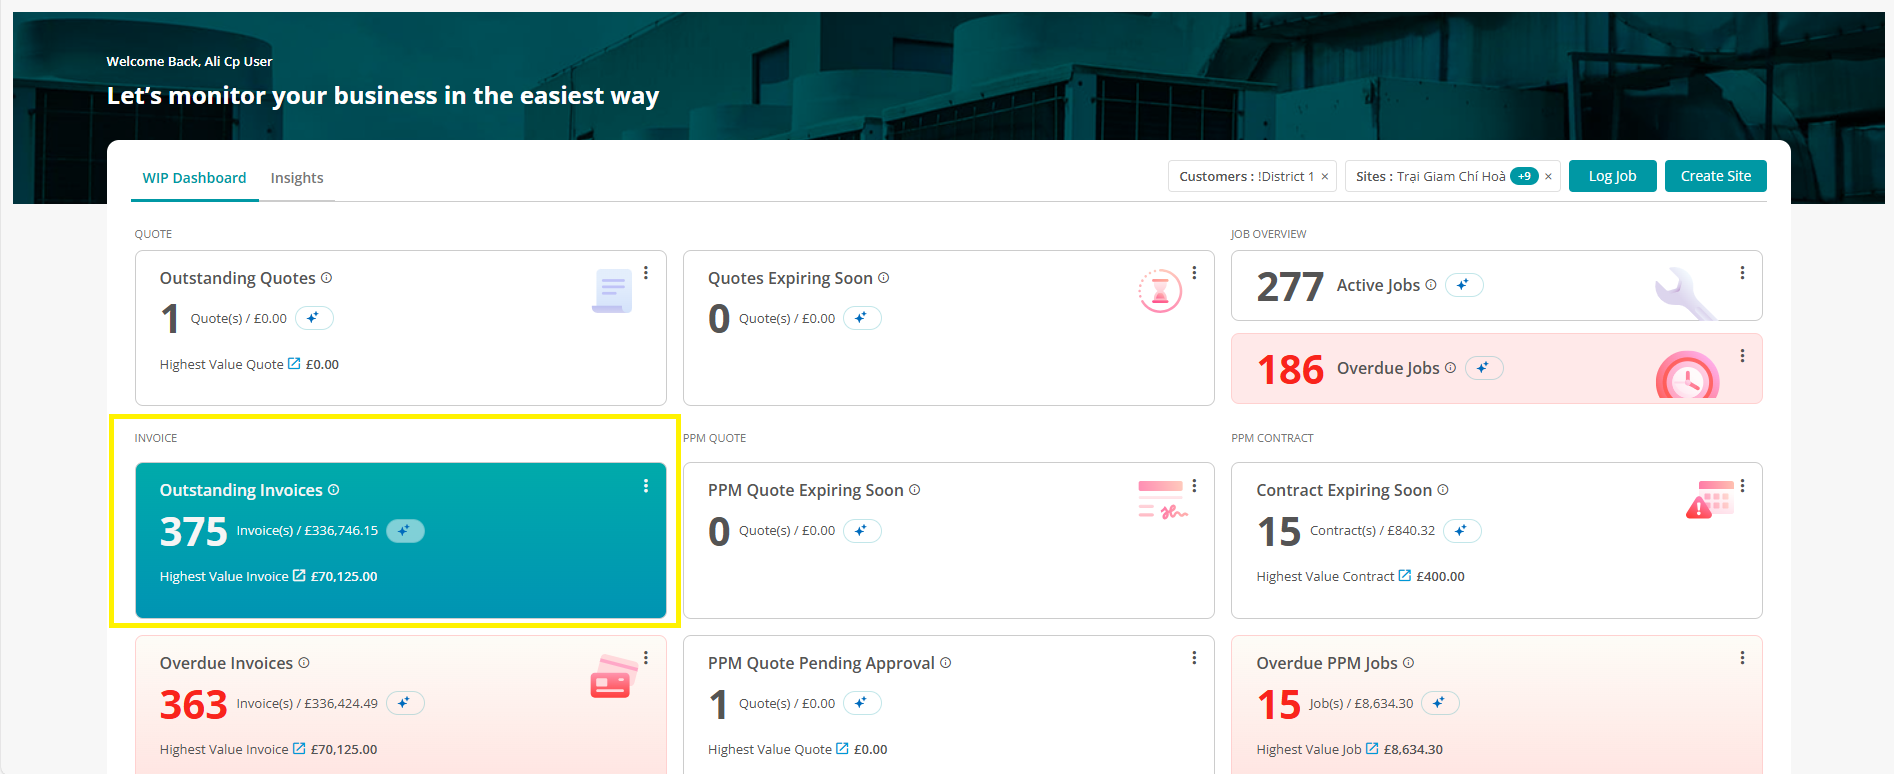
And detailed trend graphs and tables: showing various patterns and categorised data for your work items such as ‘Scheduled Jobs with SLA’s’ (service level agreements) and ‘Job Volume Trends’.
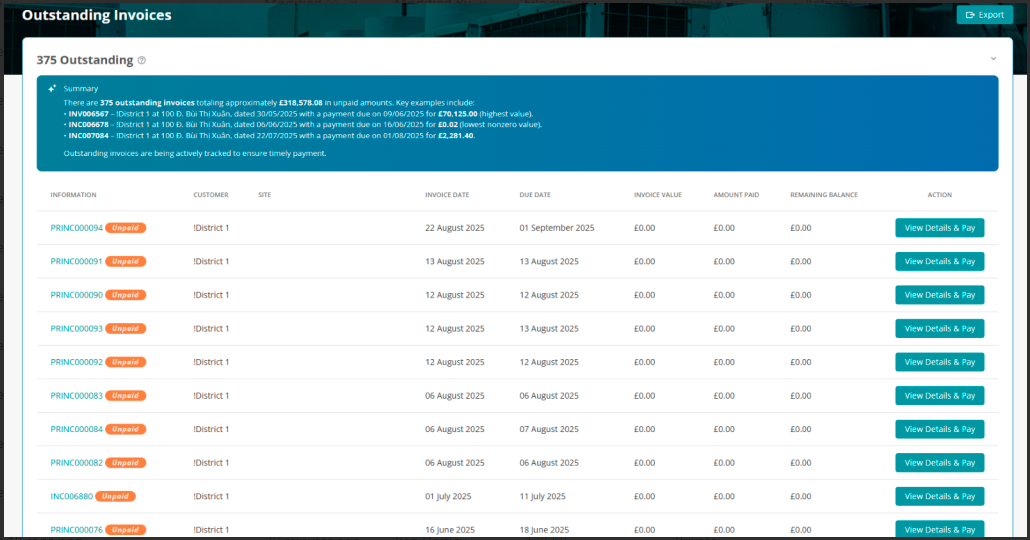
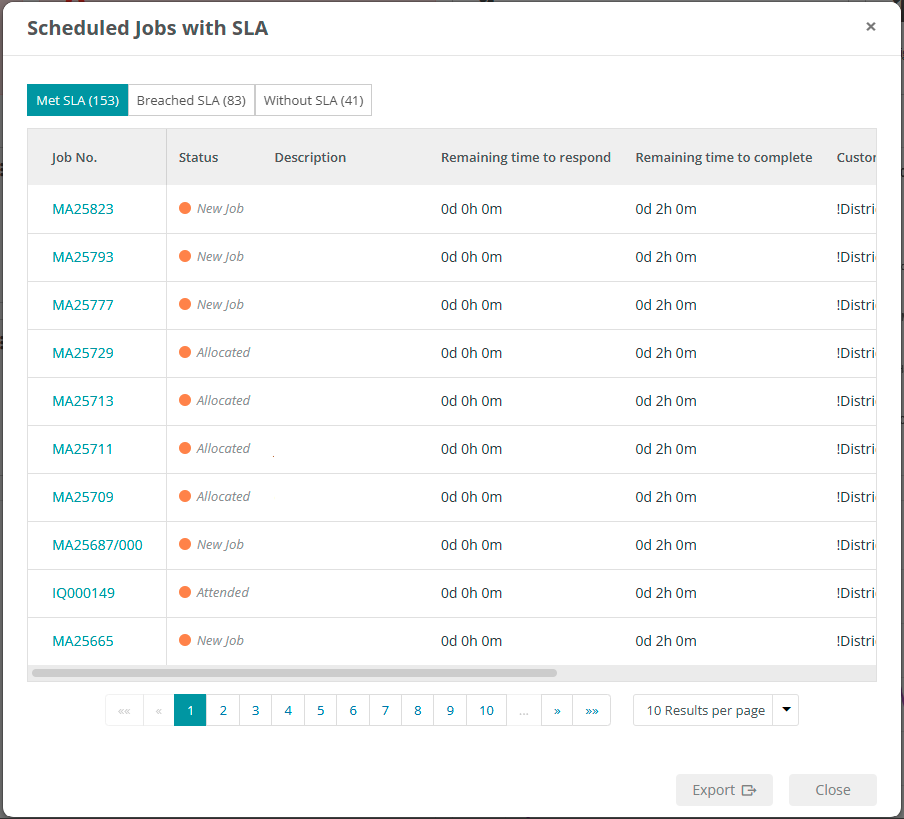
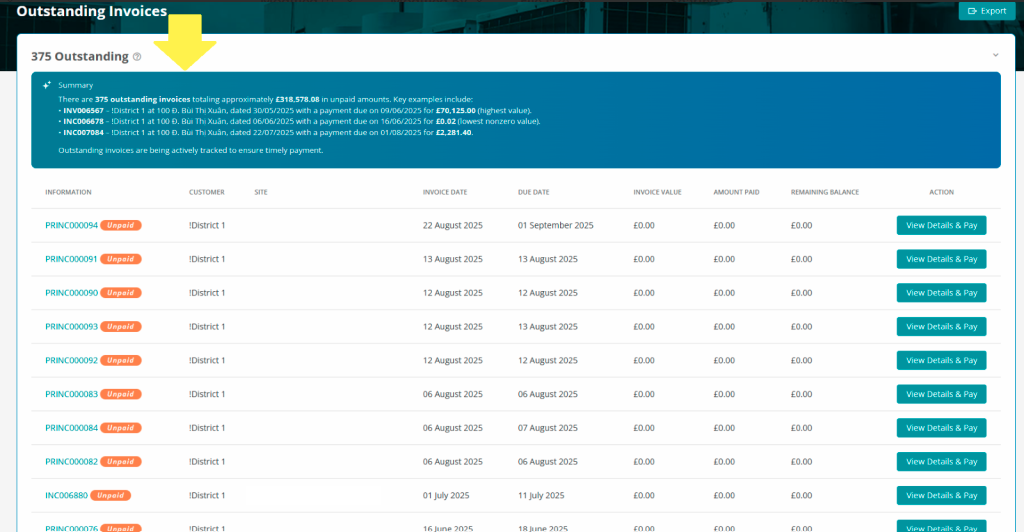
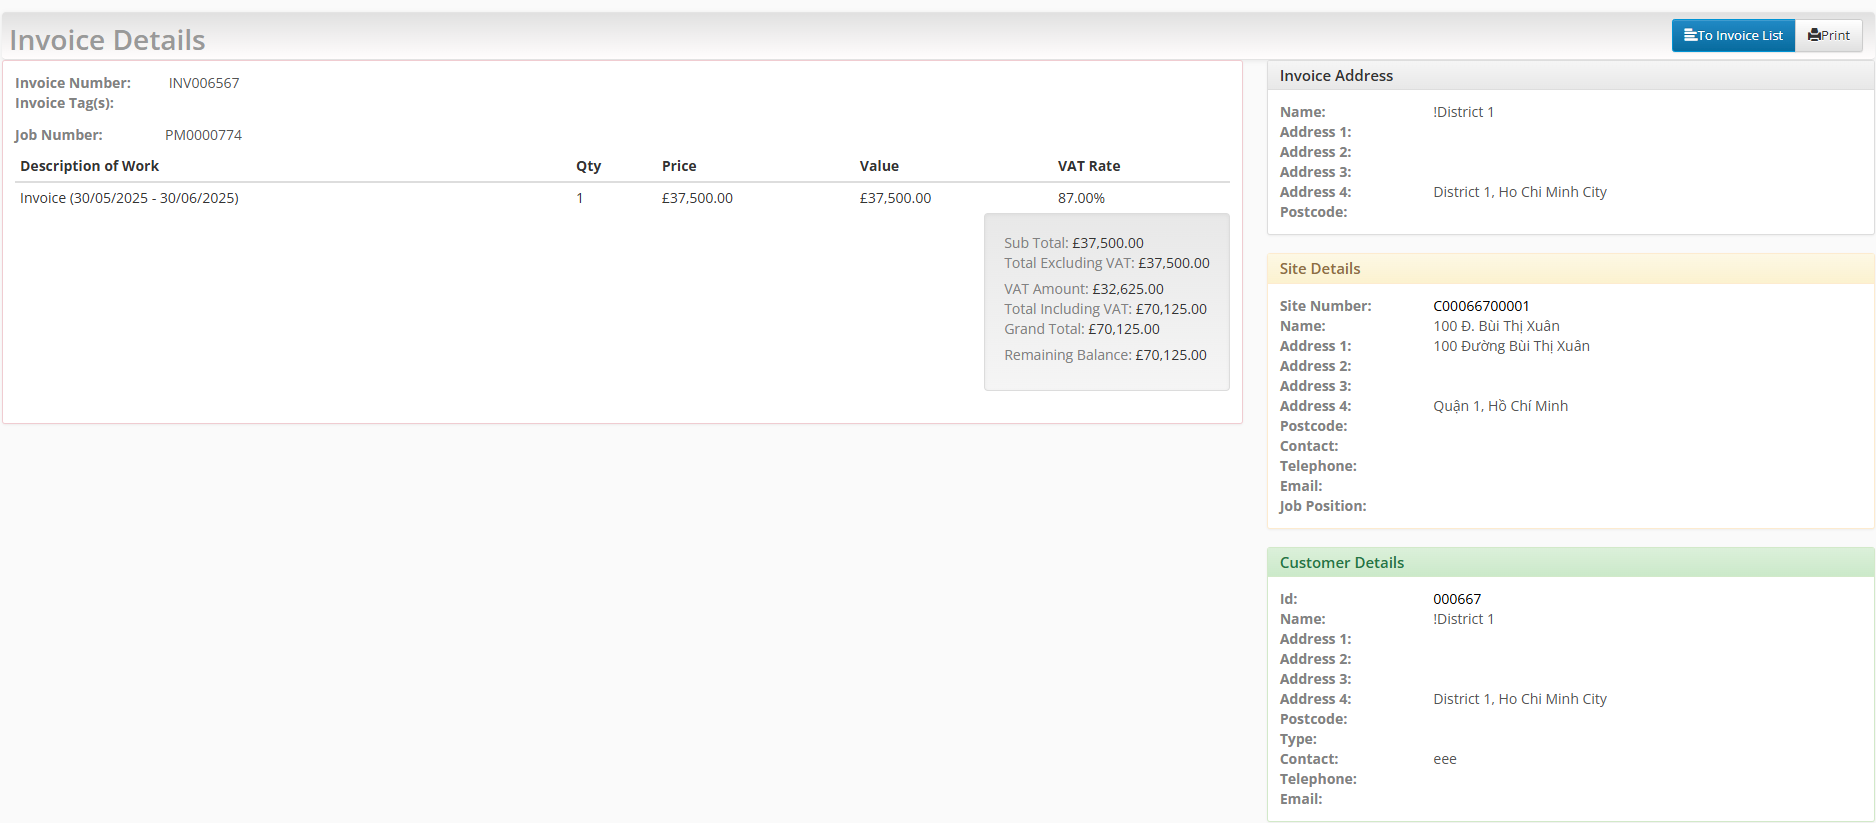
Clicking each Stat card and trend graph or table directs you to a ‘direct data view’ for that visual aid, displaying all of it’s applicable items.
Example when clicking the ‘Outstanding Invoices’ stat card:
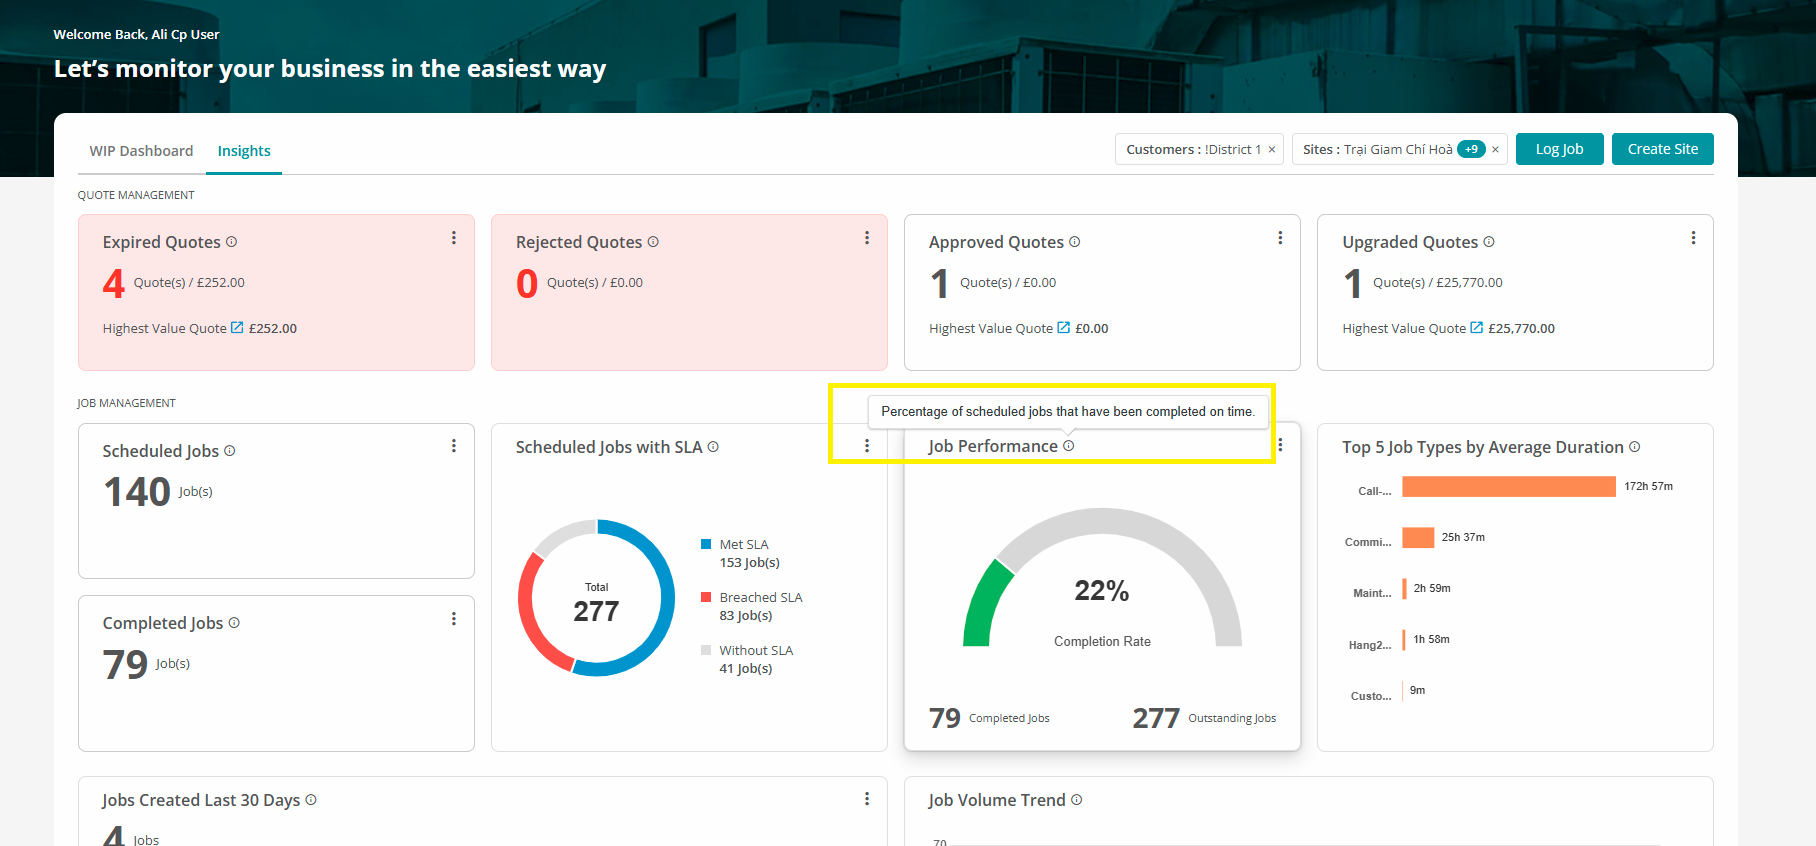
Example when clicking the ‘Scheduled Jobs with SLA’s’ trend table
AI Summaries
The dashboard provides an ‘AI Summaries’ feature within applicable areas.
What are AI Summaries?
AI Summaries are smart, auto-generated overviews that help Customer Portal users quickly understand what’s been happening across their jobs quotes and other items without needing to analyse rows of data.
Using AI technology, the system scans the most recent activity (typically from the last 30 days) and generates a plain-English summary that highlights:
-
Totals and volumes
-
Key changes since the previous period
-
Patterns or trends (e.g. increases in reactive jobs or outstanding quotes)
-
Common issues or statuses
-
Overall performance context
These summaries update daily and are personalised based on the data that you are allowed to view, giving you relevant, digestible insights at a glance.
How to view an AI summary
These are present on the WIP Dashboard and can be selected as appropriate via each sat card’s AI summary icon.
Upon selecting the icon, the dashboard will create a summary of the applicable stat card’s data for you.
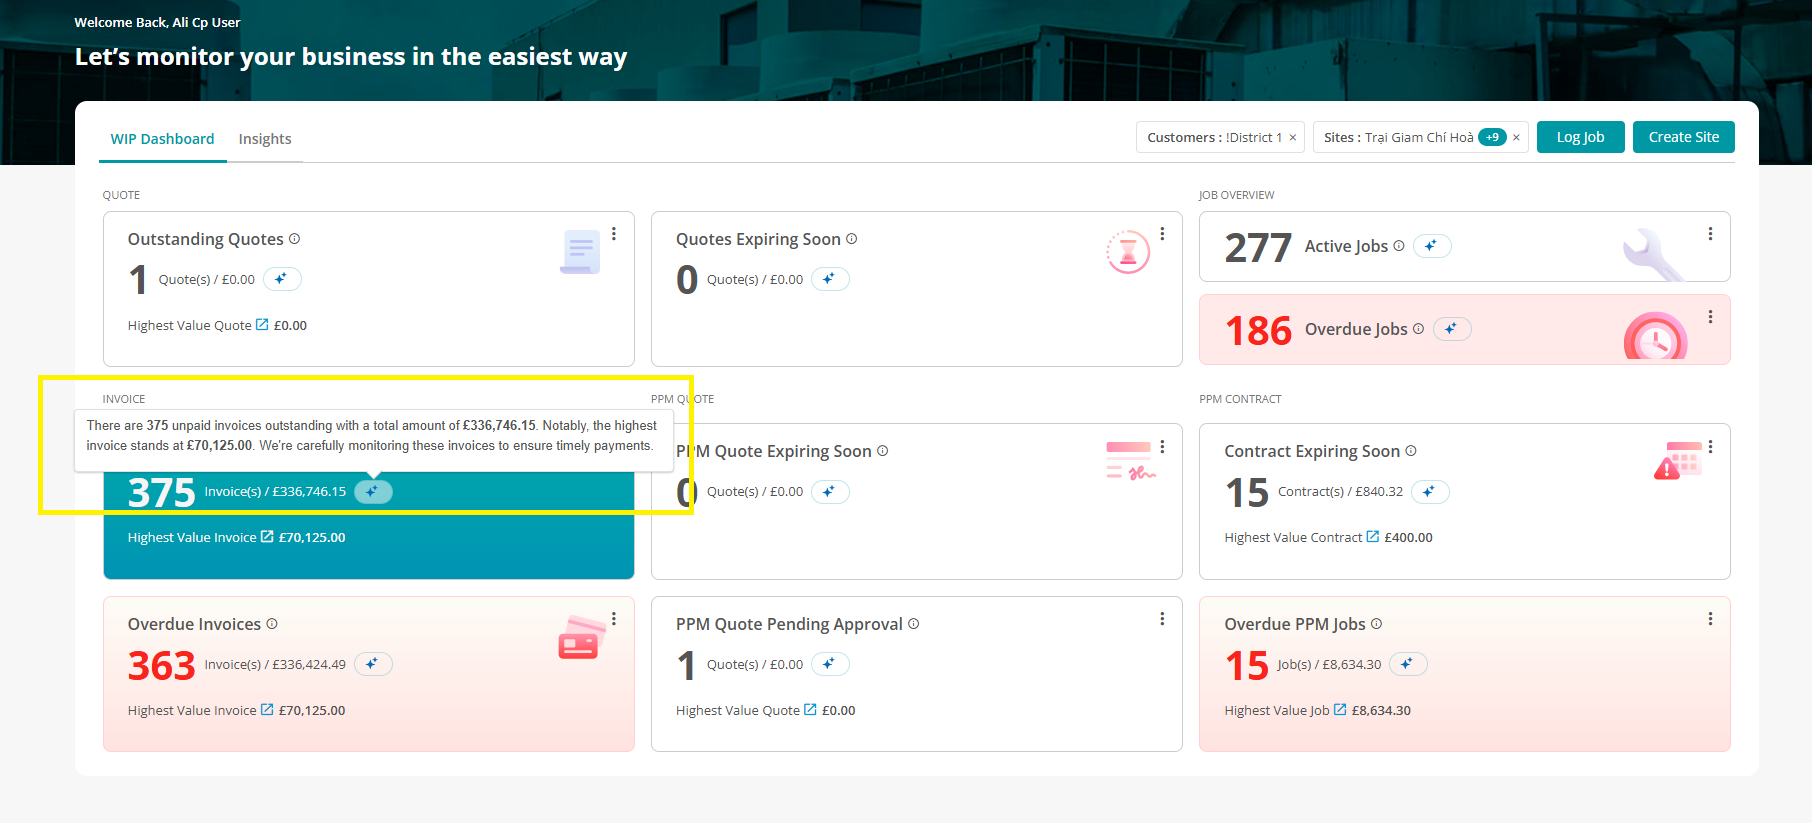
Ai Summaries are also generated when selecting the chosen stat card to view it’s direct data view.
Other General Functions
Item Definitions
Each Stat card and trend table has an ‘Info’ icon explaining what it shows/what it is intended to help with.
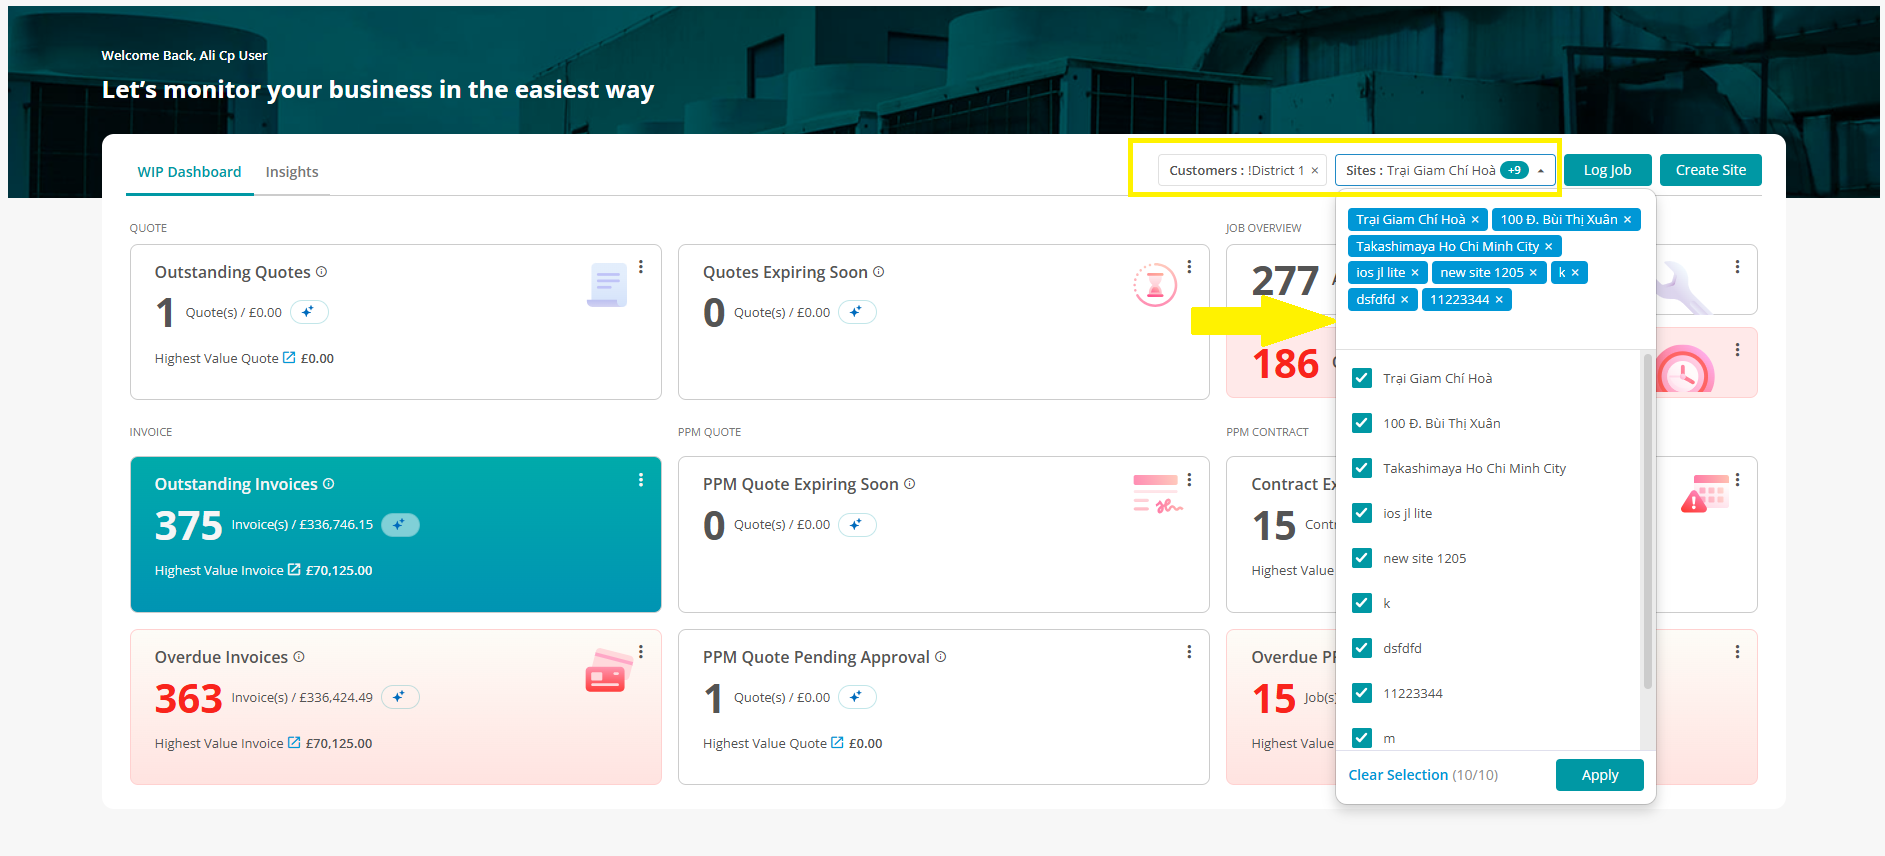
Filters
The dashboard can be filtered per customer and site depending on what ones the customer portal user has access to by using the applicable customer and site filters.
Direct Links
Items referenced within a stat card or trend table are directly linked and can be navigated to via their applicable redirect icon.
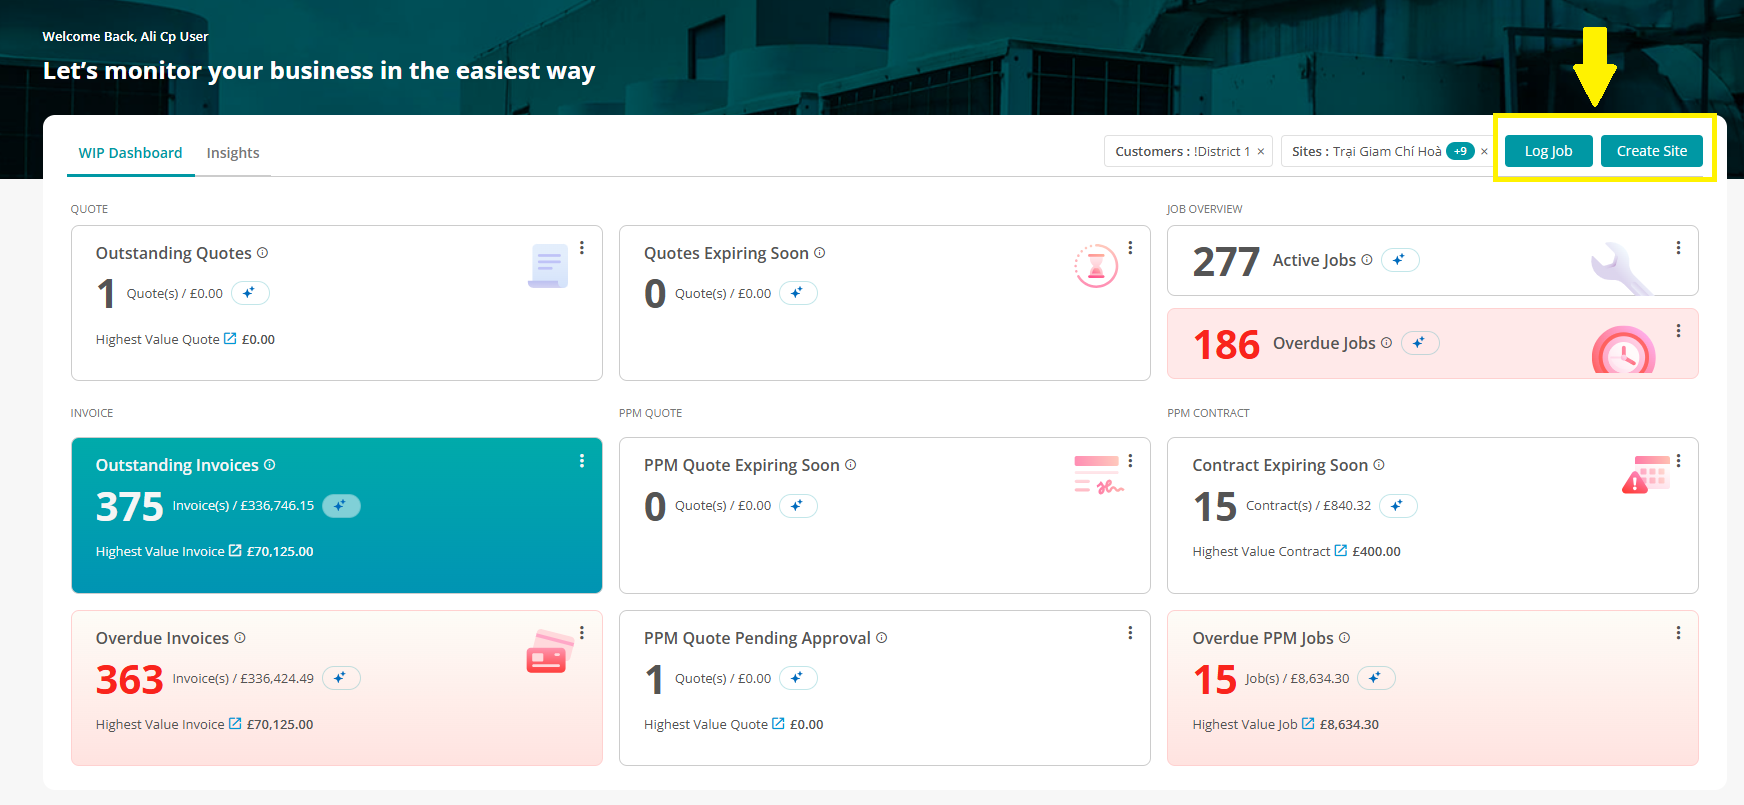
Creating Items
Customer portal users can log jobs and create new sites for their account via the dashboard screen without needing to navigate away from any data being used within the dashboard.
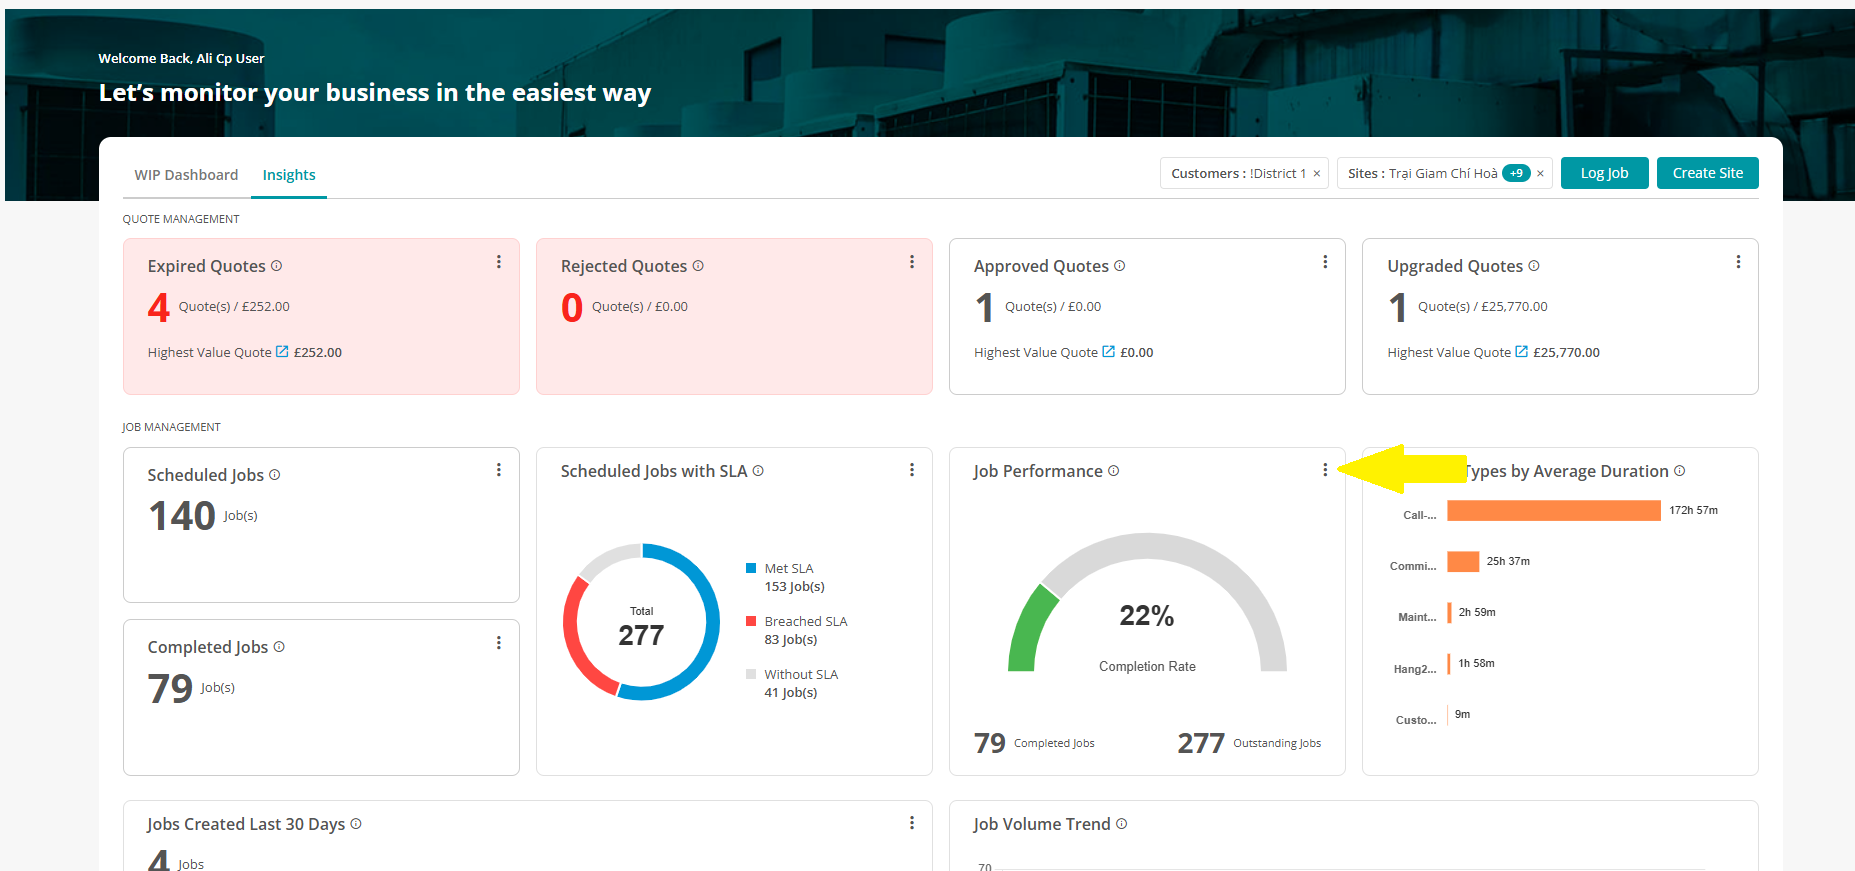
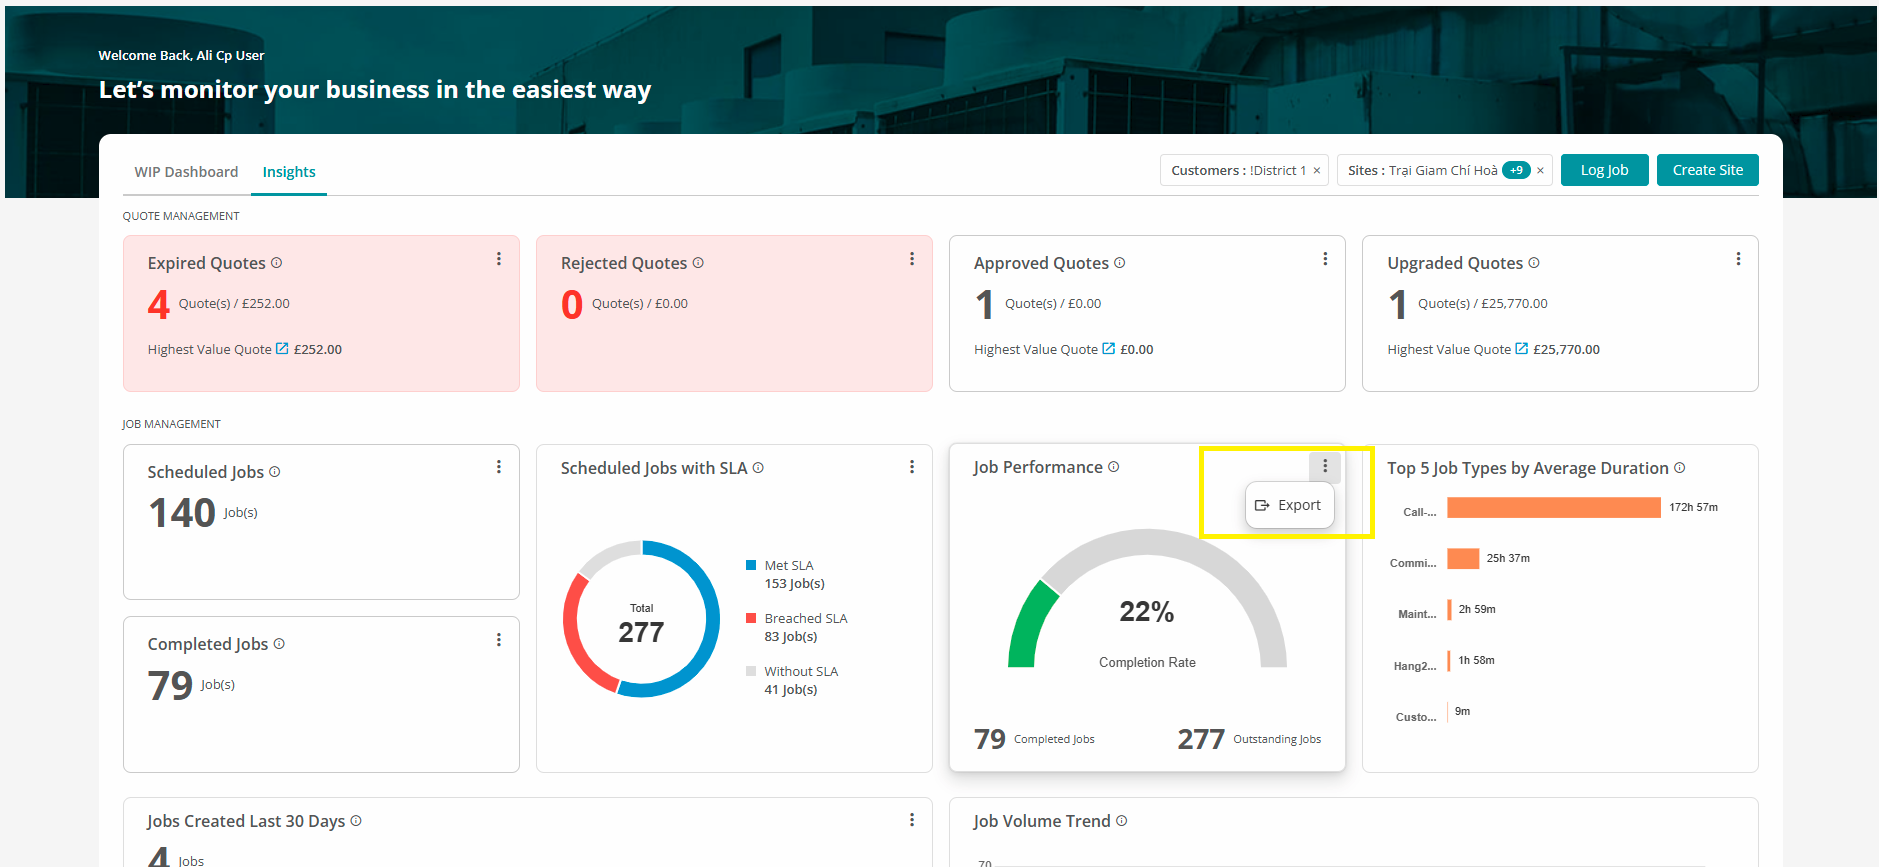
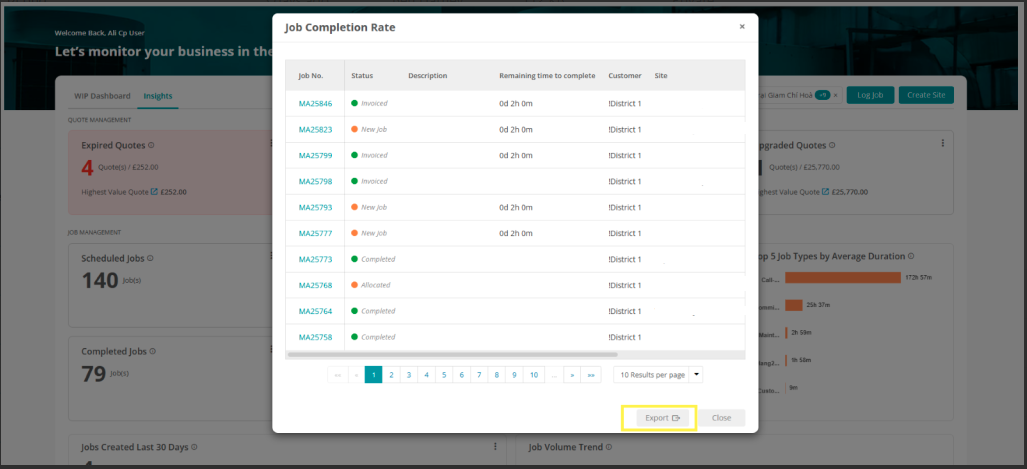
Exporting Data
Many of the stat card and trend tables and the data within them can be exported to csv via their applicable ‘3 dots’ icon > export > review the data > export.
FAQs
Q: What is the AI-Powered Customer Dashboard?
A: It’s a smart, visual overview designed to give you instant insights into your ongoing work including job activity, quote statuses, and other key updates, without needing to request reports or make follow-up calls.
Q: I don’t see the dashboard when I log in
A: Your service provider may not have enabled the AI Dashboard for your account. Please contact them directly for access.
Q: Can multiple users from the same organisation access this?
A: Yes, as long as each user has portal access and the dashboard is enabled, they can use it independently from their customer portal account.
Q: What type of information does the dashboard show me?
A: The dashboard shows details and trends of your current and completed jobs, quotes, invoices, PPM contracts and key site-based activity. You’ll also see AI generated summaries that highlight key details or upcoming actions.
Q: Do I need to do anything to access the dashboard?
A: No. As long as your service provider has this feature enabled, the tab will appear automatically when you log in to your Customer Portal. There’s no setup required on your side.
Q: How often is the dashboard information updated?
A: It updates automatically, based on real-time activity from your provider. As jobs are completed or invoices raised, you’ll see those updates reflected in the dashboard.
Q: Will I see data from other customers?
A: No. The dashboard is unique to your company. You’ll only ever see data related to your own sites, jobs, and interactions with your service provider.
Further Support
For further information or assistance with the above, contact our Support Team on 0800 326 5561 or email support@joblogic.com. Alternatively, our Customer Success Management team can be reached by emailing customersuccess@joblogic.com
Publishing Details
This document was written and produced by Joblogic’s Technical Writing team and was last updated on the date stated above. Be aware that the information provided may be subject to change following further updates on the matter becoming available or new releases within the system. Additionally, details within the guide may vary depending on your Joblogic account’s user permissions and settings or the electronic device being used.